Graph effect of dropping "rare" values from a vector of data
Source:R/graphs.R
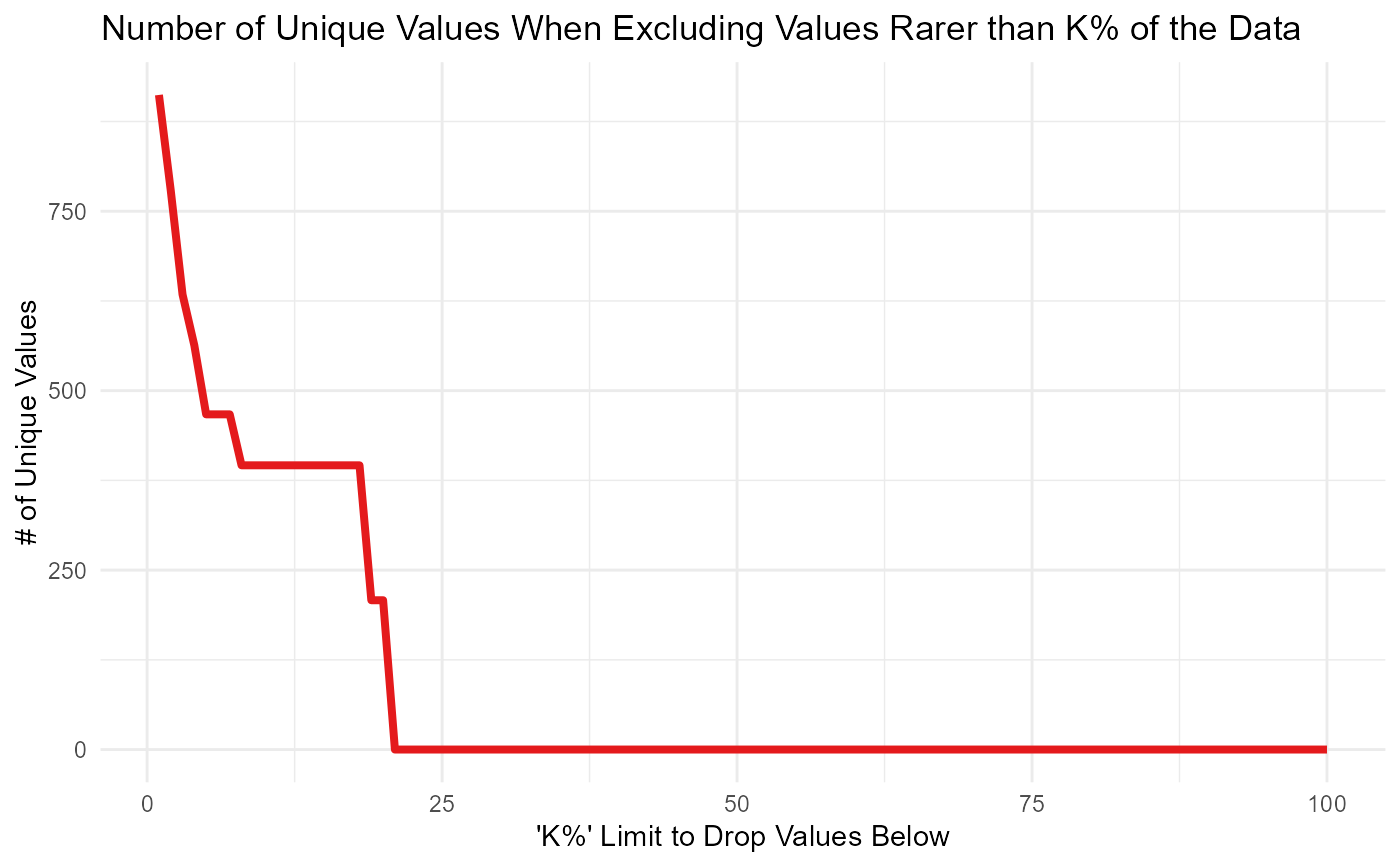
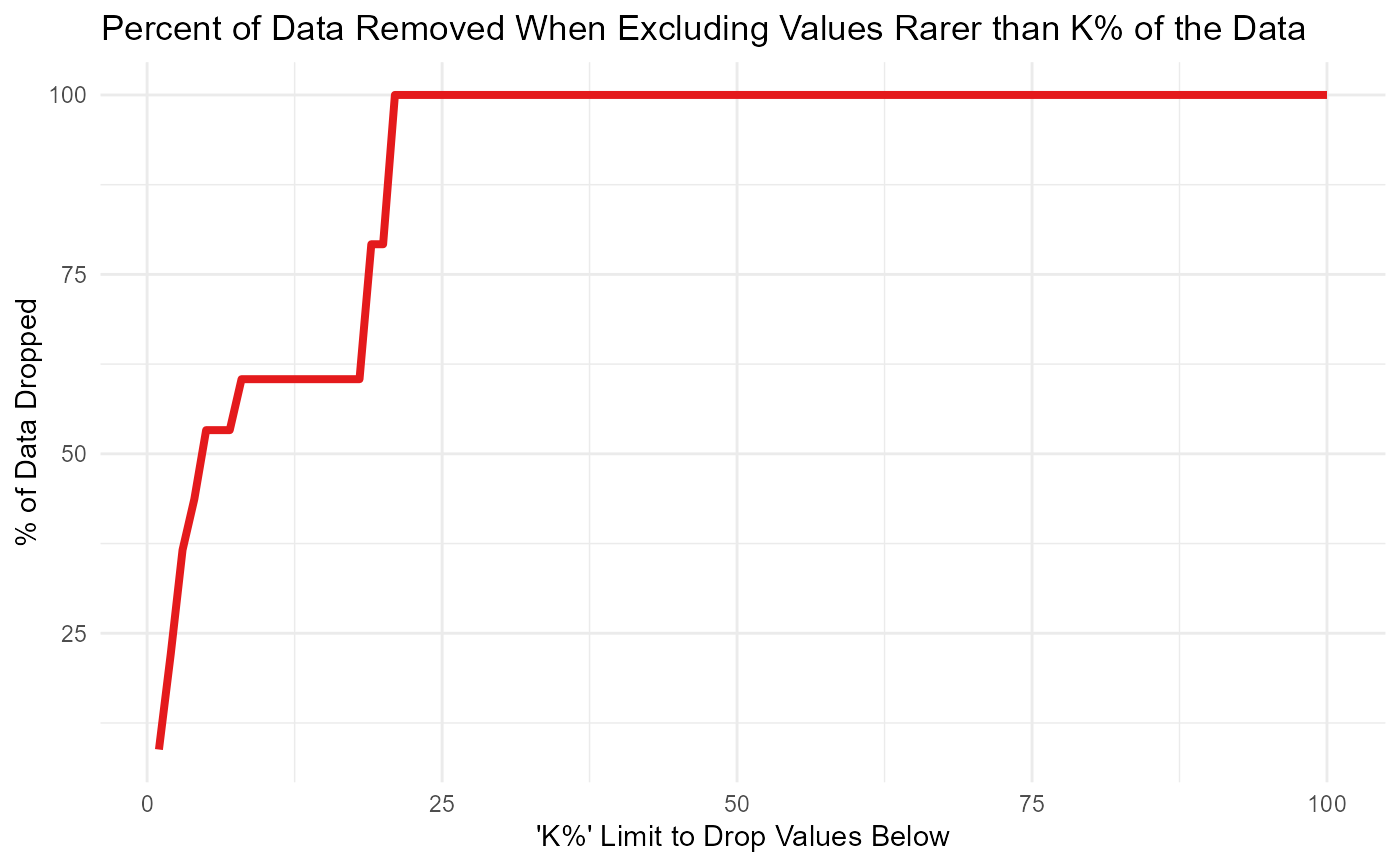
graph_group_rare_values.RdMakes a graph showing what either the number of unique values or the percent of values are dropped when excluding values that are less common than k% of the data for every value of k from 1%-100%.
graph_group_rare_values(data, percent_dropped = FALSE)
Arguments
| data | A vector of strings or numbers. |
|---|---|
| percent_dropped | If FALSE (default), will show the number of unique values in the data after excluding values that are rarer than k% (from 1-99%). Else, will show the percent of the data dropped after excluding values that are rarer than k% (from 1-99%) |
Value
A ggplot2 graph