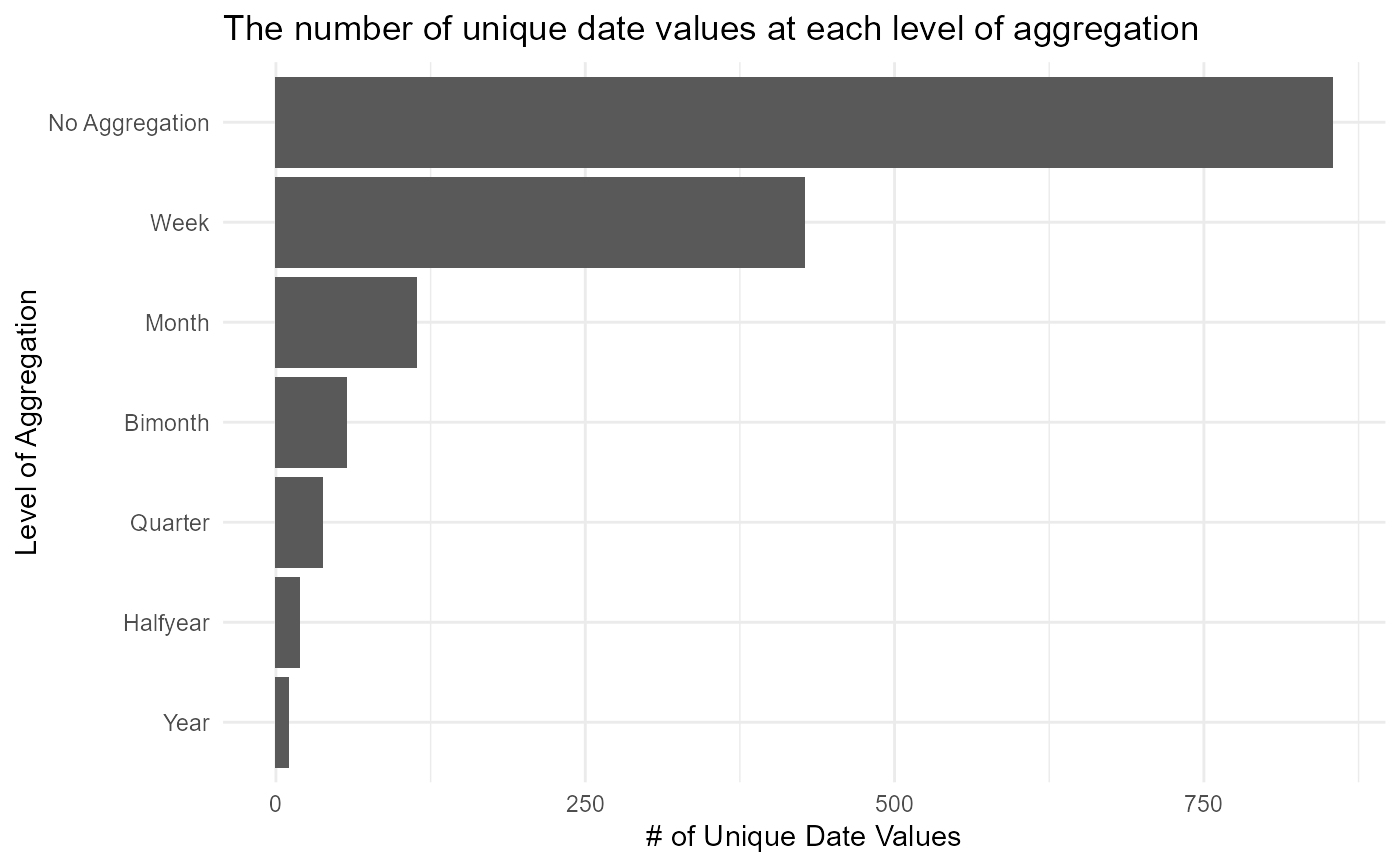
Create a barplot showing the number of unique dates at each level of aggregation
Source:R/graphs.R
graph_aggregate_dates.RdThis takes a vector of Dates and creates a barplot showing how many unique dates are in the data, at the original inputted unit and at every level of aggregation (week, month, bimonth, quarter, halfyear, year).
graph_aggregate_dates(data)
Arguments
| data | A vector of dates in the Date format. |
|---|
Value
A ggplot2 graph